I was at a gathering at Hendricks Park in Eugene when I heard this unfamiliar buzz coming from the ornamental shrubs, azaleas as I recall. I slipped away and quietly retrieved my recording gear from the car. The bird was soon found, a Spotted Towhee, sitting in plain view, buzzing instead of trilling. This is a rare song-type in my experience. I have seen lots of Spotted Towhee songs as I review material for this collection, and I don't recall another like this. But it's not so rare that it missed Pieplow's western guide, another tribute to Nathan's monumental feat of scholarship. He figures a "west coast version: single long buzz." Indeed it is. I doctored the recording just a bit. I applied a high pass filter to take out as much of the human speech as possible. They were not far away, the humans, and I didn't want anyone to be identifiable, for privacy reasons. Towhees, as you might have surmised, have no problem with human speech in their background.
I chose this cut mainly for the acoustics of the buzz, as we have already seen a typical Spotted Towhee song. Typical Spotted and Eastern Towhee songs end with a trill. We may define "trills" as a series of discrete sounds that can be discriminated on a sonogram, but cannot be resolved by ear. Prosaically, they pass too fast to count. (If they are countable, then it is a "series.") But, we can still recognize their quantum nature and identify them as trills by ear. Buzzes, in my view, are the product of a frequency contour (a single trace on the sonogram) that zigzags up and down periodically across the sonogram. Okay? These sounds have been called buzzes. Let us look into this.
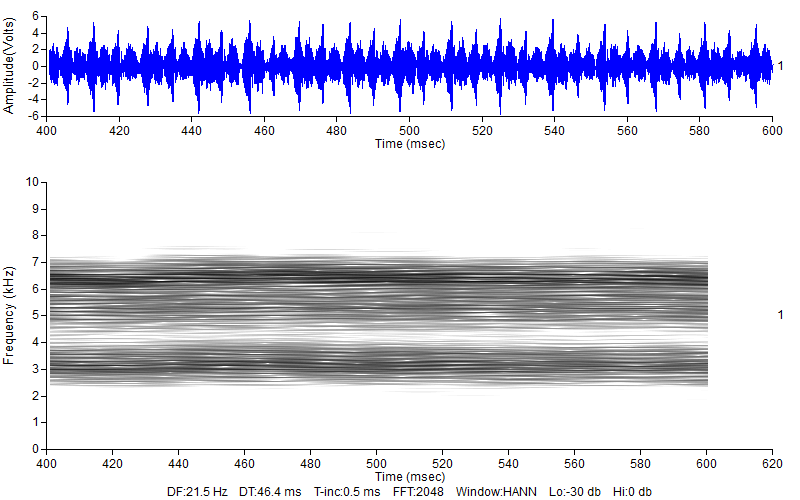
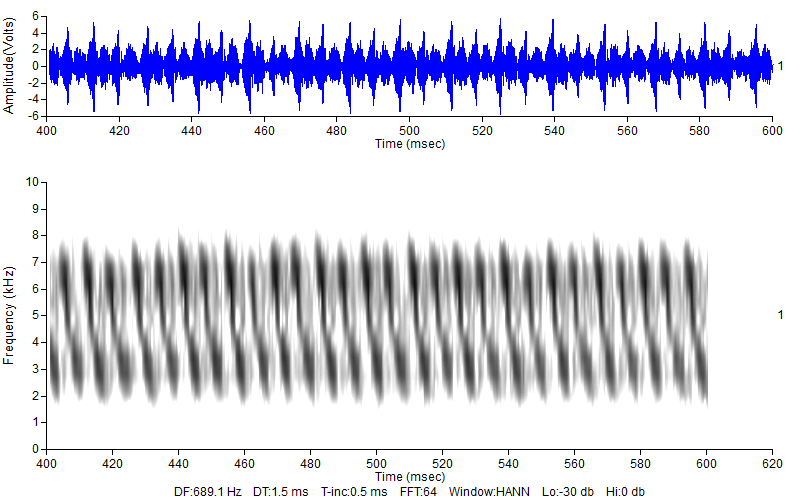
Sonograms, aka sound spectrograms, have an uncertainty principle, just like Heisenberg's. While his covered the position and momentum of a particle, the acoustic uncertainty principle trades off the temporal resolution of a sonogram with its frequency resolution. What does that mean? Resolution and precision are related. The better the frequency resolution of a sonogram, the thinner is the line representing a frequency, meaning the frequency is depicted with high confidence. (The thickness of a sonographic trace is equivalent to the confidence interval around the estimate of the frequency at any particular time.) But if you have good frequency resolution, you lose out on the time side. You don't really know where that thin spectrographic trace begins and ends with much confidence. The ironic thing is that the mathematical depiction of the sound wave never changes. It is the fact of the matter. The sonogram is merely a transform of the sinusoidal wave function, a transform produced by the seemingly magical Fourier Transform. Discovered by Jean Baptise Joseph Fourier and announced to the world in 1807, it can tease every simultaneous frequency out of the mathematical representatition of a sound wave. We just have to decide the parameters, and thereby whether to have good understanding of its time course or its frequency dynamics. Take a look below to see this exemplified.
The first sonogram was produced with extremely high frequency resolution. As you can see, the lines are very thin. The second sonogram was made with extremely high time resolution. Now we see diagonal lines. They are not connected to each other in a zigzag, they are separate. I have to call this a trill. not a buzz. Notice how well the diagonals line up with the true sound, the wave form above. The resolution used by eBird is in between these extremes, and it generally reveals the frequency-time dynamics of the sound very well. But as you now know, it is only one of may ways of looking at a sound.